collected by Widener University Bio 154 students
posted by Bruce
W. Grant, Department of Biology, Widener University, Chester, PA
19013
voc: 610-499-4017, fax:610-499-4059, grant@pop1.science.widener.edu
this page updated: 1/3/98, and is a contribution to the Ecological
Society of America's EdWeb
educational efforts.
Note: these data are from a cemetery that is no longer "rural"
and is in fact nested amidst one of the most densly
populated areas in the eastern USA in the Philadelphia, PA, - Wilmington,
DE, corridor.}
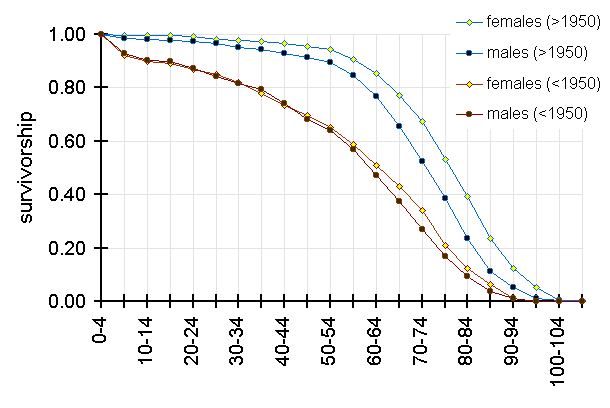
| ages | females (<1950) | males (<1950) | females (>1950) | males (>1950) |
| 0-4 | 1.0000 | 1.0000 | 1.0000 | 1.0000 |
| 5-9 | 0.9209 | 0.9299 | 0.9979 | 0.9855 |
| 10-14 | 0.8972 | 0.9030 | 0.9958 | 0.9814 |
| 15-19 | 0.8924 | 0.8970 | 0.9958 | 0.9793 |
| 20-24 | 0.8687 | 0.8731 | 0.9937 | 0.9731 |
| 25-29 | 0.8497 | 0.8418 | 0.9811 | 0.9648 |
| 30-34 | 0.8196 | 0.8149 | 0.9768 | 0.9524 |
| 35-39 | 0.7801 | 0.7955 | 0.9747 | 0.9441 |
| 40-44 | 0.7326 | 0.7403 | 0.9663 | 0.9296 |
| 45-49 | 0.6978 | 0.6821 | 0.9558 | 0.9130 |
| 50-54 | 0.6503 | 0.6418 | 0.9453 | 0.8965 |
| 55-59 | 0.5870 | 0.5687 | 0.9053 | 0.8468 |
| 60-64 | 0.5079 | 0.4731 | 0.8526 | 0.7660 |
| 65-69 | 0.4320 | 0.3761 | 0.7726 | 0.6563 |
| 70-74 | 0.3418 | 0.2701 | 0.6758 | 0.5259 |
| 75-79 | 0.2089 | 0.1701 | 0.5305 | 0.3851 |
| 80-84 | 0.1218 | 0.0925 | 0.3937 | 0.2360 |
| 85-89 | 0.0633 | 0.0358 | 0.2358 | 0.1139 |
| 90-94 | 0.0127 | 0.0104 | 0.1242 | 0.0518 |
| 95-99 | 0.0000 | 0.0015 | 0.0526 | 0.0124 |
| 100-104 | 0.0000 | 0.0015 | 0.0042 | 0.0021 |
| 105-109 | 0.0000 | 0.0000 | 0.0042 | 0.0000 |
survivorship curve for males and females who died before and after 1950 (Chester Rural Cemetery)
